Memory Logger
Memory Logger is a simple tool for gathering information about a running process. Such things as memory usage, stdout and stack traces can be sampled, either on a single process or on multiple nodes in a job scheduling environment. Currently PBS is the only job scheduling system supported.
Basic usage
In its simplest use case scenario, you encapsulate the command you would normally run with out Memory Logger as an argument to Memory Logger:
memory_logger.py --run "mpiexec -n 2 /absolute/path/to/moose_test-opt -i simple_diffusion.i -r 5"
```
!alert note
Always use absolute paths between those --run double quotes. Memory Logger has no knowledge on paths
like: '../../ or ~/some/path'

Memory Logger will launch your process as normal, and begin to track the two processes that
launched. When Memory Logger detects that the process/s has exited (for good or for ill), it will
explain where the log was saved. You can then instruct Memory Logger to open this file, and display
its information either using Matplotlib (--plot), or by formatting the information and outputting it
to stdout (--read).

The items displayed are self-explanatory except perhaps for the percentage. The percentage is the
current percent of memory used at this point in time out of the total that will be consumed. This is
a post processing technique on the log file itself.

If we wanted, we can ask memory_logger to increase its sample rate to obtain more accurate usage:

```text
memory_logger.py  --repeat-rate .01 \
--run "mpiexec -n 2 /absolute/path/to/moose_test-opt -i simple_diffusion.i -r 5"
Okay... A bit too accurate, as several samples remained unchanged during tracking. However sometimes more is desirable, though just not printed in this fashion. For data dumps like this, using Matplotlib is far more efficient.
Using Matplotlib

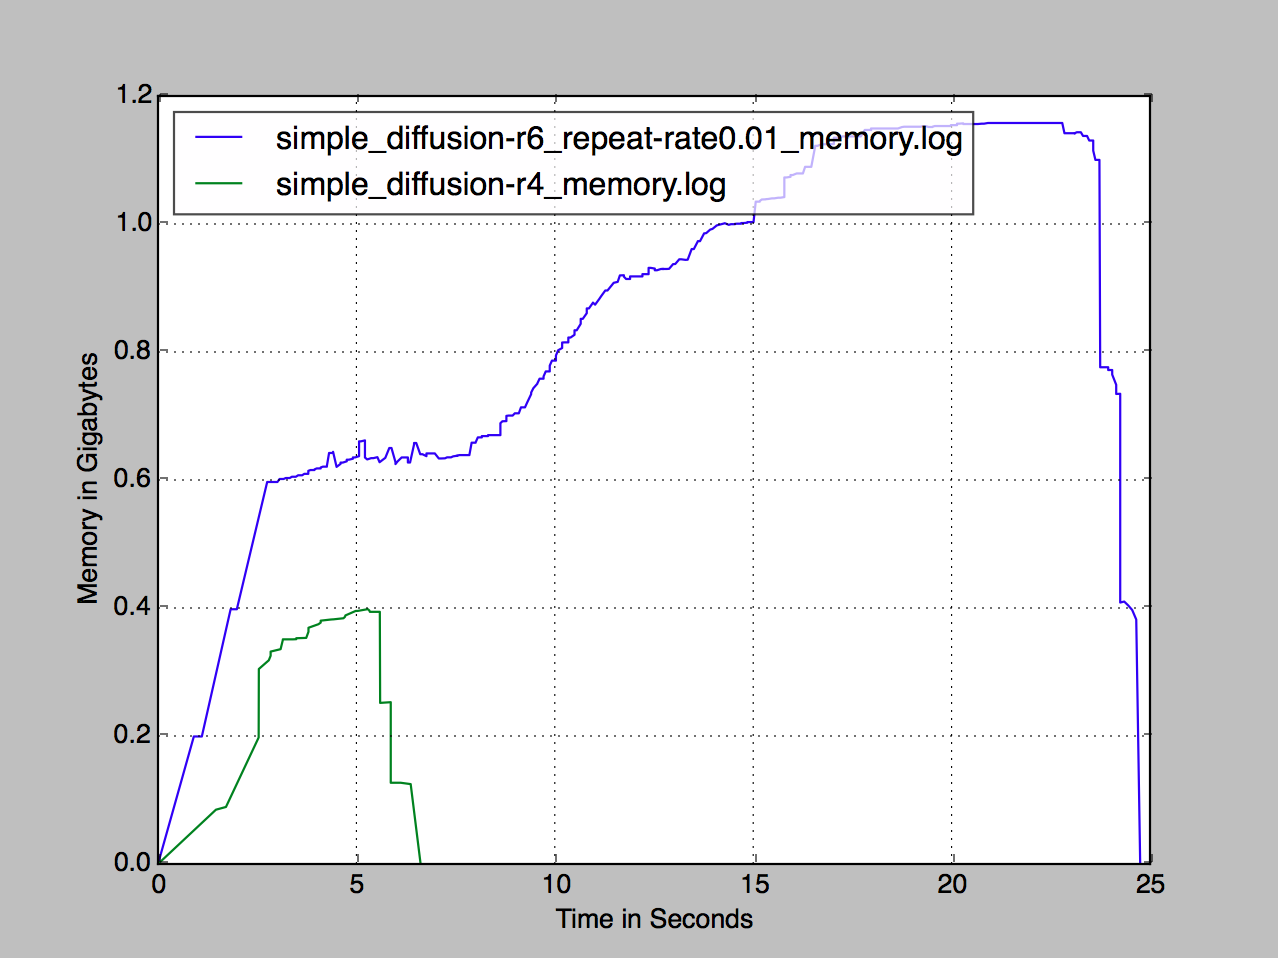
Figure 1: Example memory logger plot.
We can visualize the results by plotting the data with Matplotlib (Figure 1):
memory_logger.py --plot simple_diffusion-r4_memory.log simple_diffusion-r6_repeat-rate0.01_memory.log
We can render multiple logs simultaneously to allow an easy comparison.
Tracking PBS jobs
Memory Logger has the ability to track your processes across multiple nodes. In order for this to work correctly, we must launch an interactive job (qsub -I). The reason for this, is we can not have PBS launch a bunch of memory_loggers all in the same fashion... Instead we need one memory_logger, acting as the server, while a bunch of others acting as agents gathering data. The only thing we need to do is provide the –pbs argument.
headnode #> qsub -I

node #> memory_logger.py --pbs \
--run "mpiexec /absolute/path/to/moose_test-opt -i simple_diffusion.i -r 5"
When Memory Logger encounters a –pbs argument, it will look at the contents of your $PBS_NODEFILE, to determine what other machines will be used to process your job. Memory Logger will remote into these machines (SSH), and launch its own memory_logger process, instructing it, how to communicate back to the original memory_logger you launched interactively.
Stack Traces, Dark Mode and other cool things
Obtaining stack traces while tracking memory usage on a single machine or across PBS nodes is the key feature of this tool. In order to do so we need to supply an additional two arguments; --pstack and --debugger gdb|lldb. Memory Logger supports two debuggers for the purpose of obtaining a stack trace (gdb or lldb).
memory_logger.py --pstack --debugger gdb \
--run "mpiexec /absolute/path/to/moose_test-opt -i simple_diffusion.i -r 5"
The –pstack argument is used for both tracking and plotting. It tells Memory Logger to actually display stack trace information (if available in the log file).
memory_logger.py --pstack --plot simple_diffusion_memory.log
Stack traces are represented in the form of points along the Matplotlib line graph. Clicking on these dots will cause memory_logger.py to print the actual stack trace gleamed at that time to stdout. However, if you choose to display all this junk on the terminal, you can with –read:
memory_logger.py --pstack --read simple_diffusion_memory.log
<not going to paste this data here. I am telling ya, its pages and pages>
You can also display stdout along the Matplotlib graph:
memory_logger.py --pstack --stdout --plot simple_diffusion_memory.log

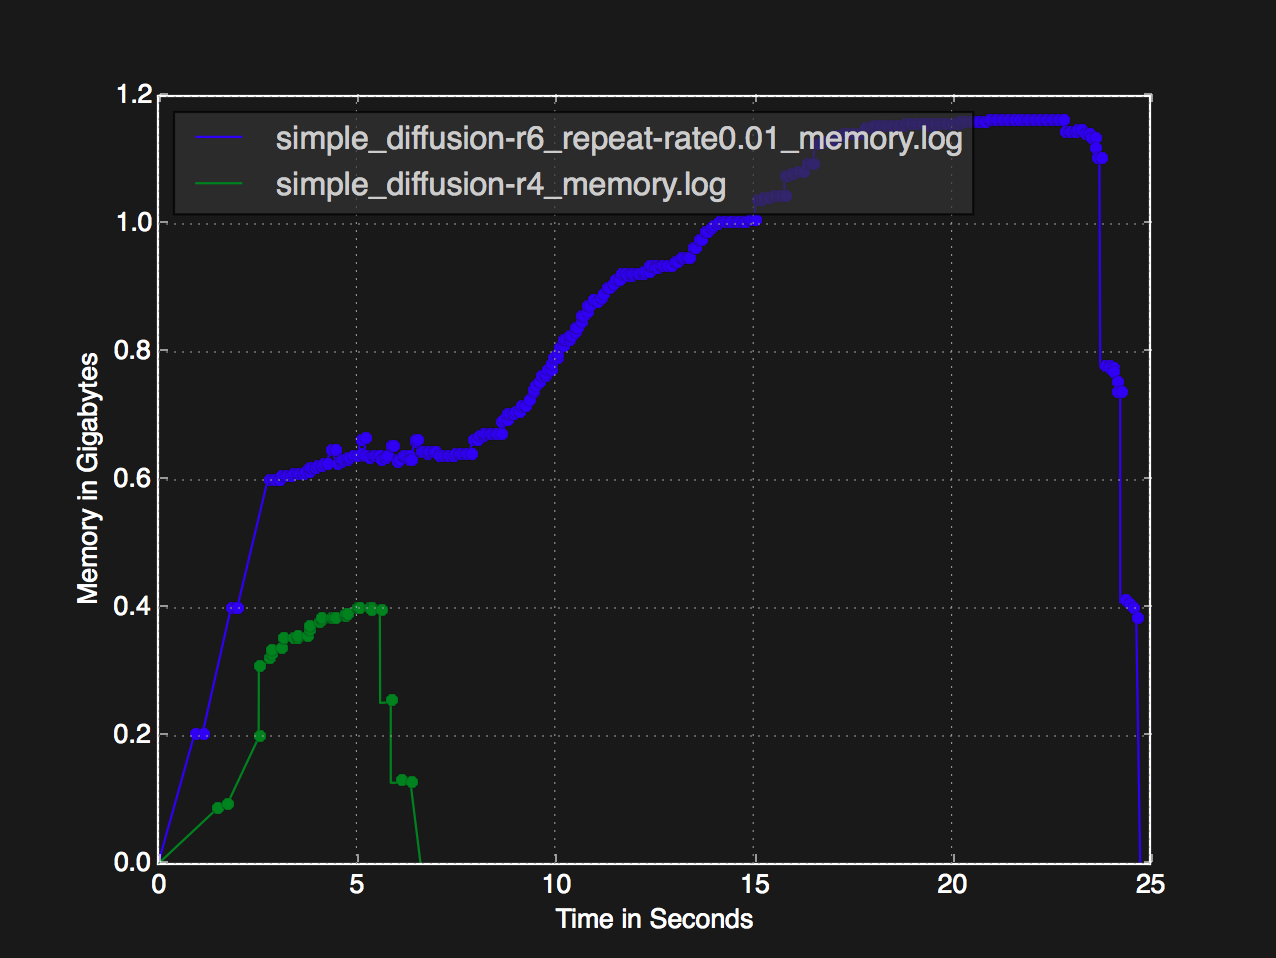
–darkmode
That white back ground to bright for you? Try dark mode:
memory_logger.py --pstack \
--darkmode \
--plot simple_diffusion-r4_memory.log simple_diffusion-r6_repeat-rate0.01_memory.log